Cartographic design
Cartographic design or map design is the process of crafting the appearance of a map, applying the principles of design and knowledge of how maps are used to create a map that has both aesthetic appeal and practical function. It shares this dual goal with almost all forms of design; it also shares with other design, especially Graphic design, the three skill sets of artistic talent, scientific reasoning, and technology. As a discipline, it integrates design, geography, and geographic information science.

Arthur H. Robinson, considered the father of cartography as an academic research discipline in the United States, stated that a map not properly designed "will be a cartographic failure." He also claimed, when considering all aspects of cartography, that "map design is perhaps the most complex."[1]
History

From ancient times to the 20th Century, cartography was a craft or trade. Most map makers served several years as an apprentice, learning the skills of the master, with little room for innovation other than adapting to changing production technology. That said, there were notable exceptions, such as the occasional introduction of a novel Map projection, and the advent of thematic mapping in the 19th Century highlighted by the work of Charles Dupin and Charles Joseph Minard in France. As late as 1948, Erwin Raisz's General Cartography, the standard English textbook on the subject, reads as a set of instructions of how to construct maps in keeping with tradition, with very little reflection on why it is done that way.[2] This was despite the fact that Raisz himself was a very creative designer, developing a style of Terrain depiction on physiographic maps that few have been able to replicate.[3]
Advances in cartographic production technology in the 20th Century, especially the advent and widespread availability of color Offset printing, then a multitude of advances spurred on by World War II, such as Photolithography, gave cartographers a larger palette of design options, and made it easier to creatively innovate. This was synchronized with the widespread expansion of higher education, during which most cartography training transitioned from an apprenticeship to a college degree (typically using Raisz's textbook in America). The new generation of cartography professionals and professors began to reflect on why some maps seemed to be better (in beauty and function) than others, and to think of ways to improve design. Perhaps chief among them was Arthur Robinson, whose short but seminal work The Look of Maps (1952) set the stage for the future of cartographic design,[4] both for his early theorizing about map design, and for his honest acknowledgment of what was not yet known, soon spawning dozens of PhD dissertations. His subsequent textbook, 1953's Elements of Cartography, was a marked departure from the past, with a major focus on design, claiming to "present cartography as an intellectual art and science rather than as a sterile system of drafting and drawing procedures."[1]
Since the 1950s, a significant focus of Cartography as an academic discipline has been to improve design standards through increased scientific understanding of how maps are perceived and used, typically based on cognate disciplines such as psychology (especially perception and Gestalt psychology), Human vision, and Geography. A second research track is the investigation of the design opportunities offered by changing Technology, especially Computer graphics starting in the 1960s, Geographic information systems starting in the 1970s, and the Internet starting in the 1990s. However, as much or more of the recent innovation in cartographic design has been at the hands of professional cartographers, and their culture of freely sharing their design ideas through institutions such as the International Cartographic Association and the North American Cartographic Information Society.
The cartographic design process
As map production and reproduction technology has advanced, the process of designing and producing maps has changed considerably. Most notably, GIS and graphics software not only makes it easier and faster to create a map, but it facilitates a non-linear editing process that is more flexible than in the days of manual cartography. There is still a general procedure that cartographers generally follow:[5][6]
- Planning: The iterative nature of modern cartography makes this step somewhat less involved than before, but it is still crucial to have some form of plan. Typically, this involves answering several questions:[7]
- What is the purpose of the map? Maps serve a wide variety of purposes; they may be descriptive (showing the accurate location of geographic features to be used in a variety of ways, like a street map), exploratory (showing the distribution of phenomena and their properties, to look for underlying patterns and processes, like many thematic maps), explanatory (educating the audience about a specific topic), or even rhetorical (trying to convince the audience to believe or do something).
- Who is the audience? Maps will be more useful if they cater to the intended audience. This audience could range from the cartographer herself (desiring to learn about a topic by mapping it), to focused individuals or groups, to the general public. Several characteristics of the audience can aid this process, if they can be determined, such as: their level of knowledge about the subject matter and the region being covered; their skill in map reading and understanding of geographic principles (e.g., do they know what 1:100,000 means?); and their needs, motivations and biases.
- Is a map the best solution? There are times when a map could be made, but a chart, photograph, text, or other tool may better server the purpose.
- What datasets are needed? The typical map will require data to serve several roles, including information about the primary purpose, as well as supporting background information.
- What medium should be used? Different mapping media, such as posters, brochures, folded maps, page maps, screen displays, and web maps have advantages and disadvantages for different purposes, audiences, and usage contexts.
- Data Collection: In the era of Geographic information systems, it seems like vast amounts of data are available for every conceivable topic, but they must be found and obtained. Frequently, available datasets are not perfect matches for the needs of the project at hand, and must be augmented or edited. Also, it is still common for there to be no available data on the specific topic, requiring the cartographer to create them, or derive them from existing data using GIS tools.
- Design and Implementation: This step involves making decisions about all of the aspects of map design, as listed below, and implementing them using computer software. In the manual drafting era, this was a very linear process of careful decision making, in which some aspects needed to be implemented before others (often, projection first). However, current GIS and graphics software enables interactive editing of all of these aspects interchangeably, leading to a non-linear, iterative process of experimentation, evaluation, and refinement.
- Production and Distribution: The last step is to produce the map in the chosen medium, and distribute it to the audience. This could be as simple as a desktop printer, or sending it to a press, or developing an interactive Web mapping site.
Map design in the Cartographic Process

Cartographic design is one part of a larger process in which maps play a central role. This cartographic process begins with a real or imagined environment or setting. As map makers gather data on the subject they are mapping (usually through technology and/or remote sensing), they begin to recognize and detect patterns that can be used to arrange the data for map creation (i.e., they think about the data and its patterns as well as how to best visualize them on a map). After this, the cartographer compiles the data and experiments with the many different methods of map design and production (including generalization, symbolization, and other production methods) in an attempt to encode and portray the data on a map that will allow the map user to decode and interpret the map in the way that matches the intended purpose of the map maker. Next, the user of the map reads and analyzes the map by recognizing and interpreting the symbols and patterns that are found on the map. This leads the user to take action and draw conclusions based on the information that they find on the map. In this way, maps help shape how we view the world based on the spatial perspectives and viewpoints that they help create in our mind.[8]
Map purpose and selection of information

Robinson codified the mapmaker's understanding that a map must be designed foremost with consideration to the audience and its needs, stating that from the very beginning of mapmaking, maps "have been made for some particular purpose or set of purposes".[9] The intent of the map should be illustrated in a manner in which the percipient (the map reader) acknowledges its purpose in a timely fashion.[10] The principle of figure-ground refers to this notion of engaging the user by presenting a clear presentation, leaving no confusion concerning the purpose of the map. This will enhance the user's experience and keep their attention. If the user is unable to identify what is being demonstrated in a reasonable fashion, the map may be regarded as useless.
Making a meaningful map is the ultimate goal. Alan MacEachren explains that a well designed map "is convincing because it implies authenticity".[11] An interesting map will no doubt engage a reader. Information richness or a map that is multivariate shows relationships within the map. Showing several variables allows comparison, which adds to the meaningfulness of the map. This also generates hypothesis and stimulates ideas and perhaps further research. In order to convey the message of the map, the creator must design it in a manner which will aid the reader in the overall understanding of its purpose. The title of a map may provide the "needed link" necessary for communicating that message, but the overall design of the map fosters the manner in which the reader interprets it.[12]
In the 21st century it is possible to find a map of virtually anything from the inner workings of the human body to the virtual worlds of cyberspace. Therefore, there are now a huge variety of different styles and types of map – for example, one area which has evolved a specific and recognisable variation are those used by public transport organisations to guide passengers, namely urban rail and metro maps, many of which are loosely based on 45 degree angles as originally perfected by Harry Beck and George Dow.
Symbology
Cartographic symbology encodes information on the map in ways intended to convey information to the map reader efficiently, taking into consideration the limited space on the map, models of human understanding through visual means, and the likely cultural background and education of the map reader. Symbology may be implicit, using universal elements of design, or may be more specific to cartography or even to the map. National topographic map series, for example, adopt a standardised symbology, which varies from country to country.[13]
A map may have any of many kinds of symbolization. The following list provides some examples. Map coloring is another form of symbology, one whose importance can reach beyond aesthetic. In complex thematic maps, for example, the color scheme's structure can critically affect the reader's ability to understand the map's information. Modern computer displays and print technologies can reproduce much of the gamut that humans can perceive, allowing for intricate exploitation of human visual discrimination in order to convey detailed information.
Quantitative symbols give a visual indication of the magnitude of the phenomenon that the symbol represents. Two major classes of symbols are used to portray quantity. Proportional symbols change size according to phenomenon's magnitude, making them appropriate for representing statistics. Choropleth maps portray data collection areas, such as counties or census tracts, with color. Using color this way, the darkness and intensity (or value) of the color is evaluated by the eye as a measure of intensity or concentration.
Composition
As all of the symbols and thematic layers on the map are brought together, their interactions have major effects on map reading. This includes grouping and Visual hierarchy.
Generalization
A good map has to compromise between portraying the items of interest (or themes) in the right place on the map, and the need to show that item using text or a symbol, which take up space on the map and might displace some other item of information. The cartographer is thus constantly making judgements about what to include, what to leave out and what to show in a slightly incorrect place. This issue assumes more importance as the scale of the map gets smaller (i.e. the map shows a larger area) because the information shown on the map takes up more space on the ground. A good example from the late 1980s was the Ordnance Survey's first digital maps, where the absolute positions of major roads were sometimes a scale distance of hundreds of meters away from ground truth, when shown on digital maps at scales of 1:250,000 and 1:625,000, because of the overriding need to annotate the features.
Labeling and typography
Most maps label features so that the map reader can know features' names. For example, country names may be printed on a world map, each label within the outline of the country it names. Features and background may be in any color, which can make reading labels printed over them harder to read than reading text from a book.[14] Two traits of good labels are legibility and easy feature association. In order for a label to be legible, it must have a type, size and color that are easy to read. Ideally, a label would not interfere with other map features or labels. A halo may be placed around the label to contrast it against the background. A label must also be easily associated with the feature it names, regardless of the feature's category or extent. Choosing a location for a label to enhance this association while avoiding clutter and conflict with other labels is an art that incorporates many techniques. One technique is to use a different font per category of feature. For example, using an italicized, dark blue font for a water label can suggest waves. Or, labels for contour lines can be thin and have the same color as the contours. In difficult cases where there is not enough space to place the label near the feature to form an unambiguous association, a leader line can connect the label to the feature.
Placenames
Most maps use text to label places and for such things as the map title, legend and other information. Although maps are often made in one specific language, place names often differ between languages. So a map made in English may use the name Germany for that country, while a German map would use Deutschland and a French map Allemagne. A non-native term for a place is referred to as an exonym.
In some cases the correct name is not clear. For example, the nation of Burma officially changed its name to Myanmar, but many nations do not recognize the ruling junta and continue to use Burma. Sometimes an official name change is resisted in other languages and the older name may remain in common use. Examples include the use of Saigon for Ho Chi Minh City, Bangkok for Krung Thep and Ivory Coast for Côte d'Ivoire.
Difficulties arise when transliteration or transcription between writing systems is required. Some well-known places have well-established names in other languages and writing systems, such as Russia or Rußland for Росси́я, but in other cases a system of transliteration or transcription is required. Even in the former case, the exclusive use of an exonym may be unhelpful for the map user. It will not be much use for an English user of a map of Italy to show Livorno only as "Leghorn" when road signs and railway timetables show it as "Livorno". In transliteration, the characters in one script are represented by characters in another. For example, the Cyrillic letter Р is usually written as R in the Latin script, although in many cases it is not as simple as a one-for-one equivalence. Systems exist for transliteration of Arabic, but the results may vary. For example, the Yemeni city of Mocha is written variously in English as Mocha, Al Mukha, al-Mukhā, Mocca and Moka. Transliteration systems are based on relating written symbols to one another, while transcription is the attempt to spell in one language the phonetic sounds of another. Chinese writing is now usually converted to the Latin alphabet through the Pinyin phonetic transcription systems. Other systems were used in the past, such as Wade-Giles, resulting in the city being spelled Beijing on newer English maps and Peking on older ones.
Further difficulties arise when countries, especially former colonies, do not have a strong national geographic naming standard. In such cases, cartographers may have to choose between various phonetic spellings of local names versus older imposed, sometimes resented, colonial names. Some countries have multiple official languages, resulting in multiple official placenames. For example, the capital of Belgium is both Brussel and Bruxelles. In Canada, English and French are official languages and places have names in both languages. British Columbia is also officially named la Colombie-Britannique. English maps rarely show the French names outside of Quebec, which itself is spelled Québec in French.[15]

The study of placenames is called toponymy, while that of the origin and historical usage of placenames as words is etymology.
In order to improve legibility or to aid the illiterate, some maps have been produced using pictograms to represent places. The iconic example of this practice is Lance Wyman's early plans for the Mexico City Metro, on which stations were shown simply as stylized logos. Wyman also prototyped such a map for the Washington Metro, though ultimately the idea was rejected. Other cities experimenting with such maps are Fukuoka, Guadalajara and Monterrey.[16]
Projections

The Earth being spherical, any flat representation generates distortions such that shapes and areas cannot both be conserved simultaneously, and distances can never all be preserved.[17] The mapmaker must choose a suitable map projection according to the space to be mapped and the purpose of the map.
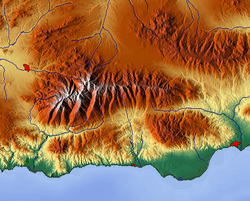
Mapping Terrain
Terrain, the shape of the Earth's surface, serves a variety of geographic tasks, and is thus a common layer in maps. Its unique nature has led to a number of methods for depicting the topographic surface.
Map types
A wide variety of different types of maps have been developed, and are available to use for different purposes.
General vs. thematic cartography


In understanding basic maps, the field of cartography can be divided into two general categories: general cartography and thematic cartography. General cartography involves those maps that are constructed for a general audience and thus contain a variety of features. General maps exhibit many reference and location systems and often are produced in a series. For example, the 1:24,000 scale topographic maps of the United States Geological Survey (USGS) are a standard as compared to the 1:50,000 scale Canadian maps. The government of the UK produces the classic 1:50,000 (replacing the older 1 inch to 1 mile) "Ordnance Survey" maps of the entire UK and with a range of correlated larger- and smaller-scale maps of great detail. Many private mapping companies have also produced thematic map series.
Thematic cartography involves maps of specific geographic themes, oriented toward specific audiences. A couple of examples might be a dot map showing corn production in Indiana or a shaded area map of Ohio counties, divided into numerical choropleth classes. As the volume of geographic data has exploded over the last century, thematic cartography has become increasingly useful and necessary to interpret spatial, cultural and social data.
A third type of map is known as an "orienteering," or special purpose map. This type of map falls somewhere between thematic and general maps. They combine general map elements with thematic attributes in order to design a map with a specific audience in mind. Oftentimes, the type of audience an orienteering map is made for is in a particular industry or occupation. An example of this kind of map would be a municipal utility map.[18]
Topographic vs. topological
A topographic map is primarily concerned with the topographic description of a place, including (especially in the 20th and 21st centuries) the use of contour lines showing elevation. Terrain or relief can be shown in a variety of ways (see Cartographic relief depiction). In the present era, one of the most widespread and advanced methods used to form topographic maps is to use computer software to generate digital elevation models which show shaded relief. Before such software existed, cartographers had to draw shaded relief by hand. One cartographer who is respected as a master of hand-drawn shaded relief is the Swiss professor Eduard Imhof whose efforts in hill shading were so influential that his method became used around the world despite it being so labor-intensive.[19][20]
A topological map is a very general type of map, the kind one might sketch on a napkin. It often disregards scale and detail in the interest of clarity of communicating specific route or relational information. Beck's London Underground map is an iconic example. Although the most widely used map of "The Tube," it preserves little of reality: it varies scale constantly and abruptly, it straightens curved tracks, and it contorts directions. The only topography on it is the River Thames, letting the reader know whether a station is north or south of the river. That and the topology of station order and interchanges between train lines are all that is left of the geographic space.[16] Yet those are all a typical passenger wishes to know, so the map fulfills its purpose.[21]
Map Layout
A typical map, whether on paper or on a web page, consists of not only the map image, but also other elements, such as a title, legend, scale bar, or even multiple maps. Composing and arranging all of the elements on the page involves just as much design skill and knowledge of how readers will use the map as designing the map image itself. In fact, this aspect of cartographic design has the most in common with graphic design.
These items are also elements of map layout.
- A legend, or key, explains the map's pictorial language.
- A title indicates the region and perhaps the theme that the map portrays.
- A neatline frames the entire map image.
- A compass rose or north arrow provides orientation.
- An overview map gives global context for the primary map.
- A bar scale translates between map measurements and real distances.
- A map projection provides a way to represent the curved surface on the plane of the map.
The map may declare its sources, accuracy, publication date and authorship, and so forth. The map image itself portrays the region.
Aesthetics
At times, the role of "beauty" in design has been discounted as extraneous, especially during the 1970s and 1980s when the focus of cartographic research was on technology and communication theory; at the time, maps were primarily thought of as a tool to get a job done, and an "artistic" map was a useless one. As technology and the discipline has matured, modern cartographers have gained increasing ability to pursue both form and function, similar to other fields of design. A new appreciation has been gained of the practical value of aesthetics: potential map users are more likely to pick up, and more likely to spend time with, a beautiful map than one that is difficult to look at. Fortunately, maps that exude a feeling of "professional," "authoritative," "well-crafted," "clear," or "informative" has gained desirability.
Map reproduction and distribution
At one time, the process of getting a map printed was a major part of the time and effort spent in cartography. While less of a concern with modern technology, it is not insignificant. Professional cartographers are asked to produce maps that will be distributed by a variety of media, and understanding the various reproduction and distribution technologies help to cater a design to work best for the intended medium.
- Inkjet printing
- Laser printing
- Offset printing, including Prepress preparation
- Animated mapping
- Web mapping
See also
- Cartography
- Map
- Geographic information systems
References
- Robinson, A.H. (1953). Elements of Cartography. New York: John Wiley & Sons. ISBN 978-0-471-72805-4.
- Raisz, Erwin, General Cartography, 2nd Edition, McGraw-Hill, 1948
- Tyner, Judith, Elements of Cartography: Tracing Fifty Years of Academic Cartography, Cartographic Perspectives, #51 (Spring 2005), 4
- Robinson, Arthur, The Look of Maps, University of Wisconsin, 1952
- Dent, Borden D., Jeffrey S. Torguson, Thomas W. Hodler, Cartography: Thematic Map Design, 6th Edition, McGraw-Hill, 2009, p.205
- Slocum, Terry A., Robert B. McMaster, Fritz C. Kessler, Hugh H. Howard, Thematic Cartography and Visualization, 3rd Edition, Pearson-Prentice Hall, 2009, p.212
- Tyner, Judith A., Principles of Map Design, Guilford Press, 2010, p.23
- "3.1 The Cartographic Process | GEOG 160: Mapping our Changing World". www.e-education.psu.edu. Retrieved 2019-12-14.
- Robinson, A.H. (1982). Early Thematic Mapping: In the History of Cartography. Chicago: The University of Chicago Press. ISBN 978-0-226-72285-6.
- MacEachren, A.M. (1995). How Maps Work. New York: The Guilford Press. ISBN 978-1-57230-040-8.
- MacEachren, A.M. (1994). Some Truth with Maps: A Primer on Symbolization & Design. University Park: The Pennsylvania State University. ISBN 978-0-89291-214-8. (p. 9)
- Monmonier, Mark (1993). Mapping It Out. Chicago: University of Chicago Press. ISBN 978-0-226-53417-6. p. 93
- Kent, Alexander; Vujakovic, Peter (2009). "Stylistic Diversity in European State 1 : 50 000 Topographic Maps". The Cartographic Journal. 46 (3): 179–213. doi:10.1179/000870409X12488753453453.
- Jill Saligoe-Simmel,"Using Text on Maps: Typography in Cartography"
- Illustrated Atlas of the World. Rand McNally. 1992. ISBN 978-0-528-83492-9.
- Ovenden, Mark (2007). Transit Maps of the World. New York, New York: Penguin Books. pp. 22, 60, 131, 132, 135. ISBN 978-0-14-311265-5.
- Albrecht, Jochen. "Maps projections". Introduction to Mapping Sciences, 2005. Retrieved 2013-08-13.
- Dutton, John. "Cartography and Visualization Part I: Types of Maps". Penn State University E-Education. Archived from the original on 2018-09-11.
- Kennelly, Patrick (2006). "A Uniform Sky Illumination Model to Enhance Shading of Terrain and Urban Areas". Cartography and Geographic Information Science. 33: 21–36. doi:10.1559/152304006777323118. S2CID 12196808.
- Ormeling, F.J. (1986-12-31). "Eduard Imhof (1895–1986)". International Cartographic Association.
- Devlin, Keith (2002). The Millennium Problems. New York, New York: Basic Books. pp. 162–163. ISBN 978-0-465-01730-0.